RailState
Rail Network Intelligence
Independent · Measured · Real-Time
RailState operates the largest independent rail sensor network in North America. Our trackside sensors photograph every train that passes, capturing car-level detail — equipment type, commodity markings, hazmat placards, container ownership, railroad, and direction of travel — across hundreds of strategic locations.
Unlike government statistics, industry surveys, or modeled estimates, RailState data is directly measured from photographic evidence. Every data point in this dashboard traces back to a physical observation of a real rail car at a known location and time. We are not an aggregator, we do not model or estimate volumes, and we are not affiliated with any railroad, shipper, or trading firm. This independence is what makes RailState data uniquely valuable for benchmarking, validation, and forward-looking intelligence.
Independent
Zero Affiliation
Not affiliated with any railroad, shipper, or trading firm. Directly measured from photographic evidence — not modeled or estimated.
Low Data Latency
< 30 min
from sensor to customer
Sensor data is captured, processed, and delivered in under 30 minutes from the time a train passes — weeks ahead of government statistics.
Granular
Car-Level Detail
Every individual rail car is captured — equipment type, commodity markings, container ownership, hazmat placards, railroad, and direction of travel.
How It Works
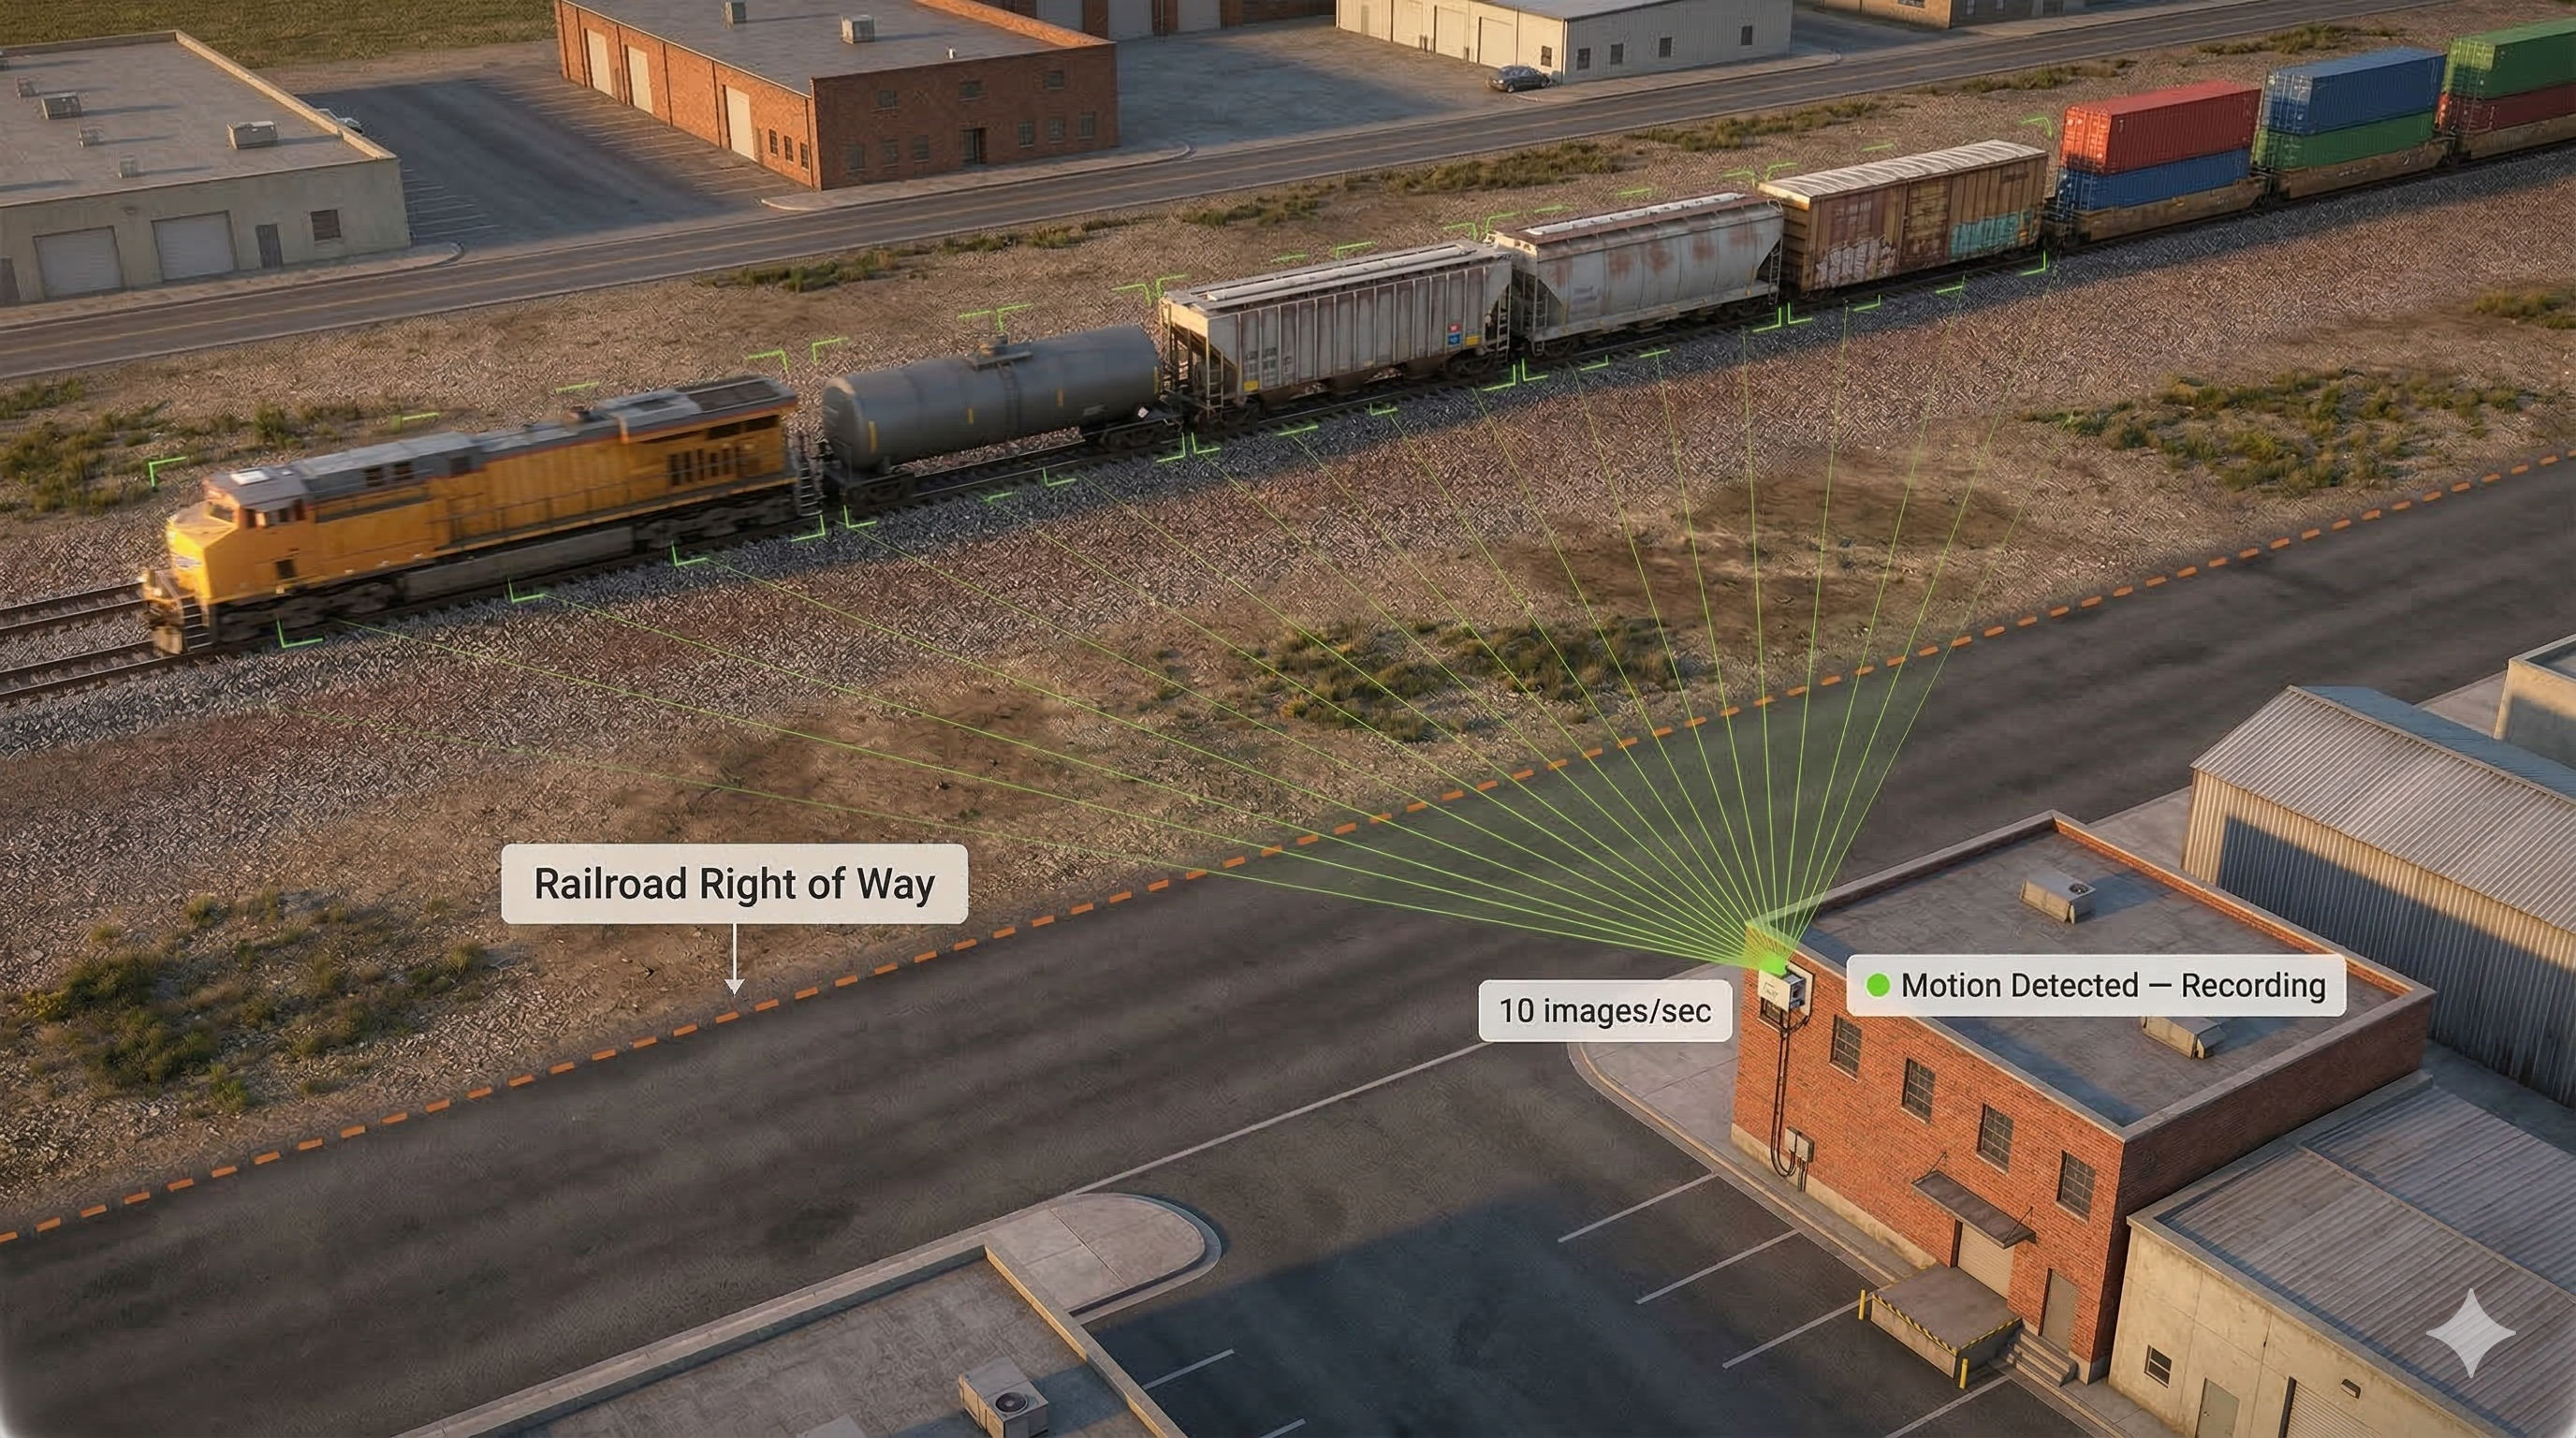
RailState deploys proprietary trackside sensor stations across the North American rail network. From the moment a train passes a sensor to the moment structured data reaches our customers — the entire pipeline completes in under 30 minutes.
RailState trackside sensor capturing train images
1
Capture
Proprietary trackside camera stations photograph every rail car as the train passes — capturing high-resolution images of reporting marks, hazmat placards, container sizes and ID numbers, and equipment details. Sensors operate autonomously 24/7 at border crossings, port gateways, major junctions, and commodity corridors across the United States and Canada.
24/7 Autonomous Operation
10 Images per Second
All Conditions −45°F to +120°F
Data extraction from rail car images
2
Process
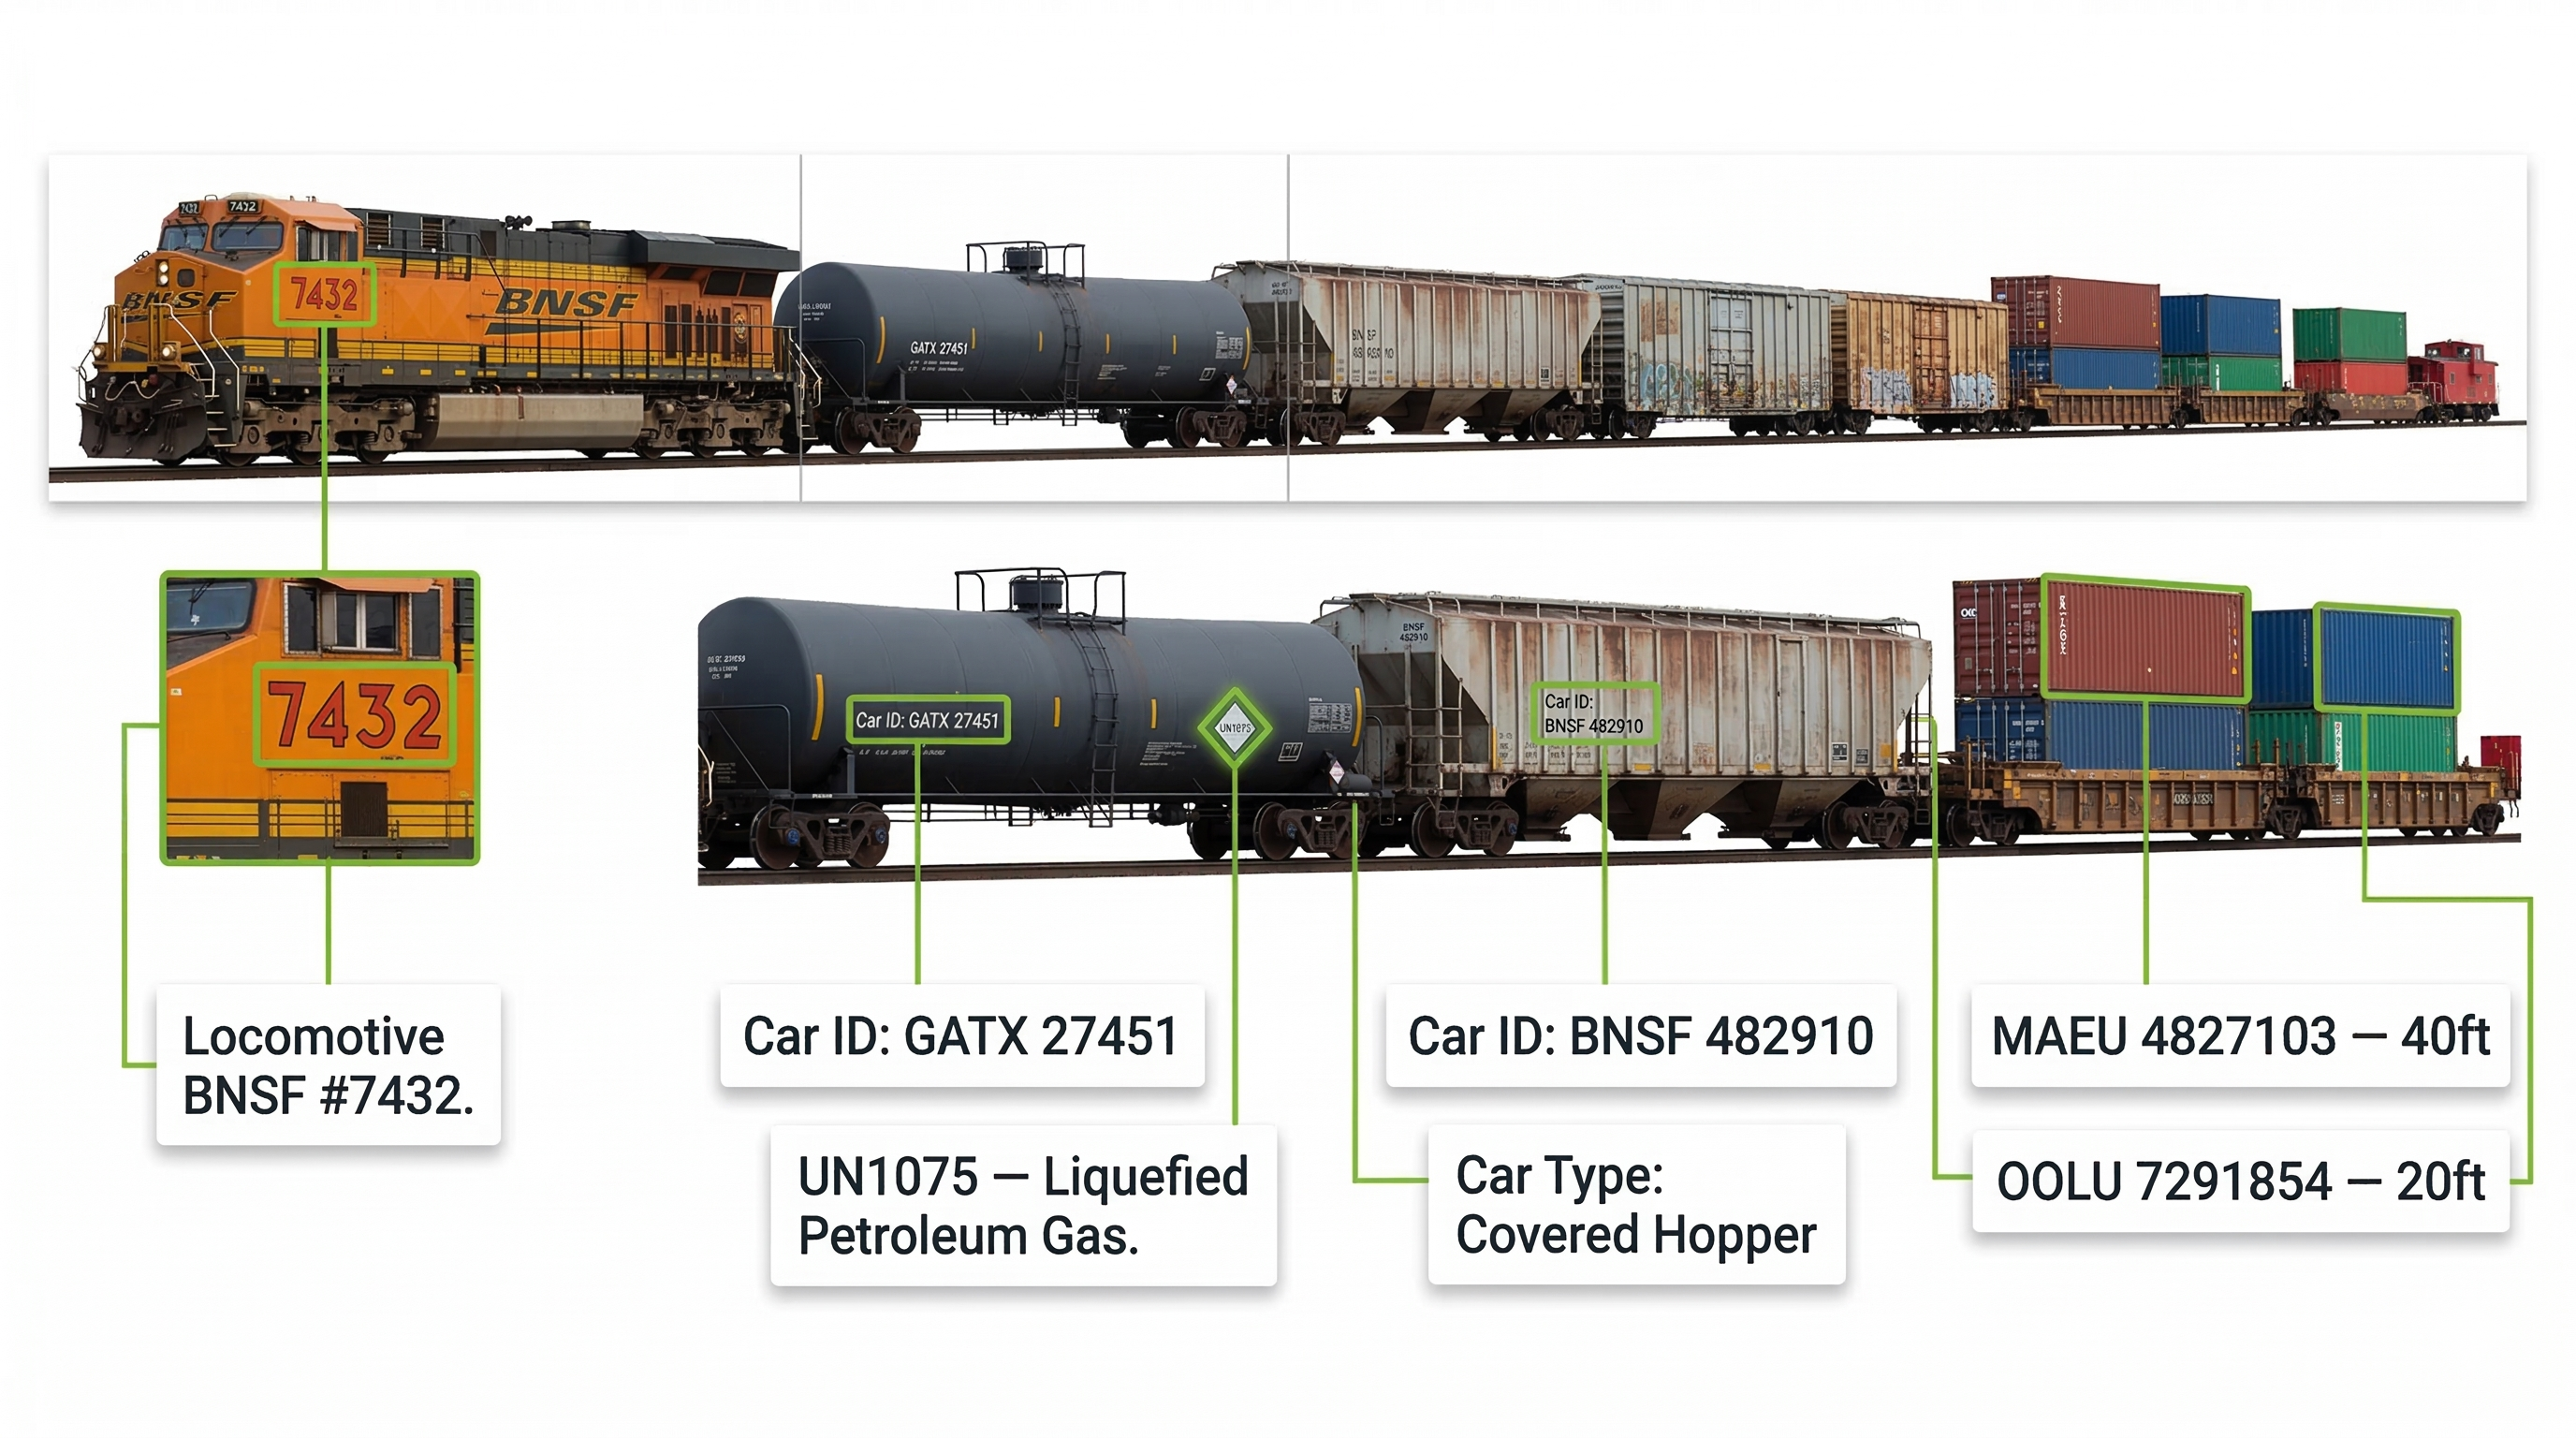
Images are transmitted to RailState's cloud infrastructure and processed by computer vision and machine learning models. The system extracts structured data from every car — equipment type, car ID, AAR code, commodity classification, hazmat UN numbers, container ownership, railroad operator, and direction of travel. Each observation is enriched with capacity estimates, train-level aggregation, and quality checks.
ML Machine Learning Classifications
40+ Data Fields per Train and Rail Car
Enriched with Industry Data
RailState data delivery to customers
3
Deliver
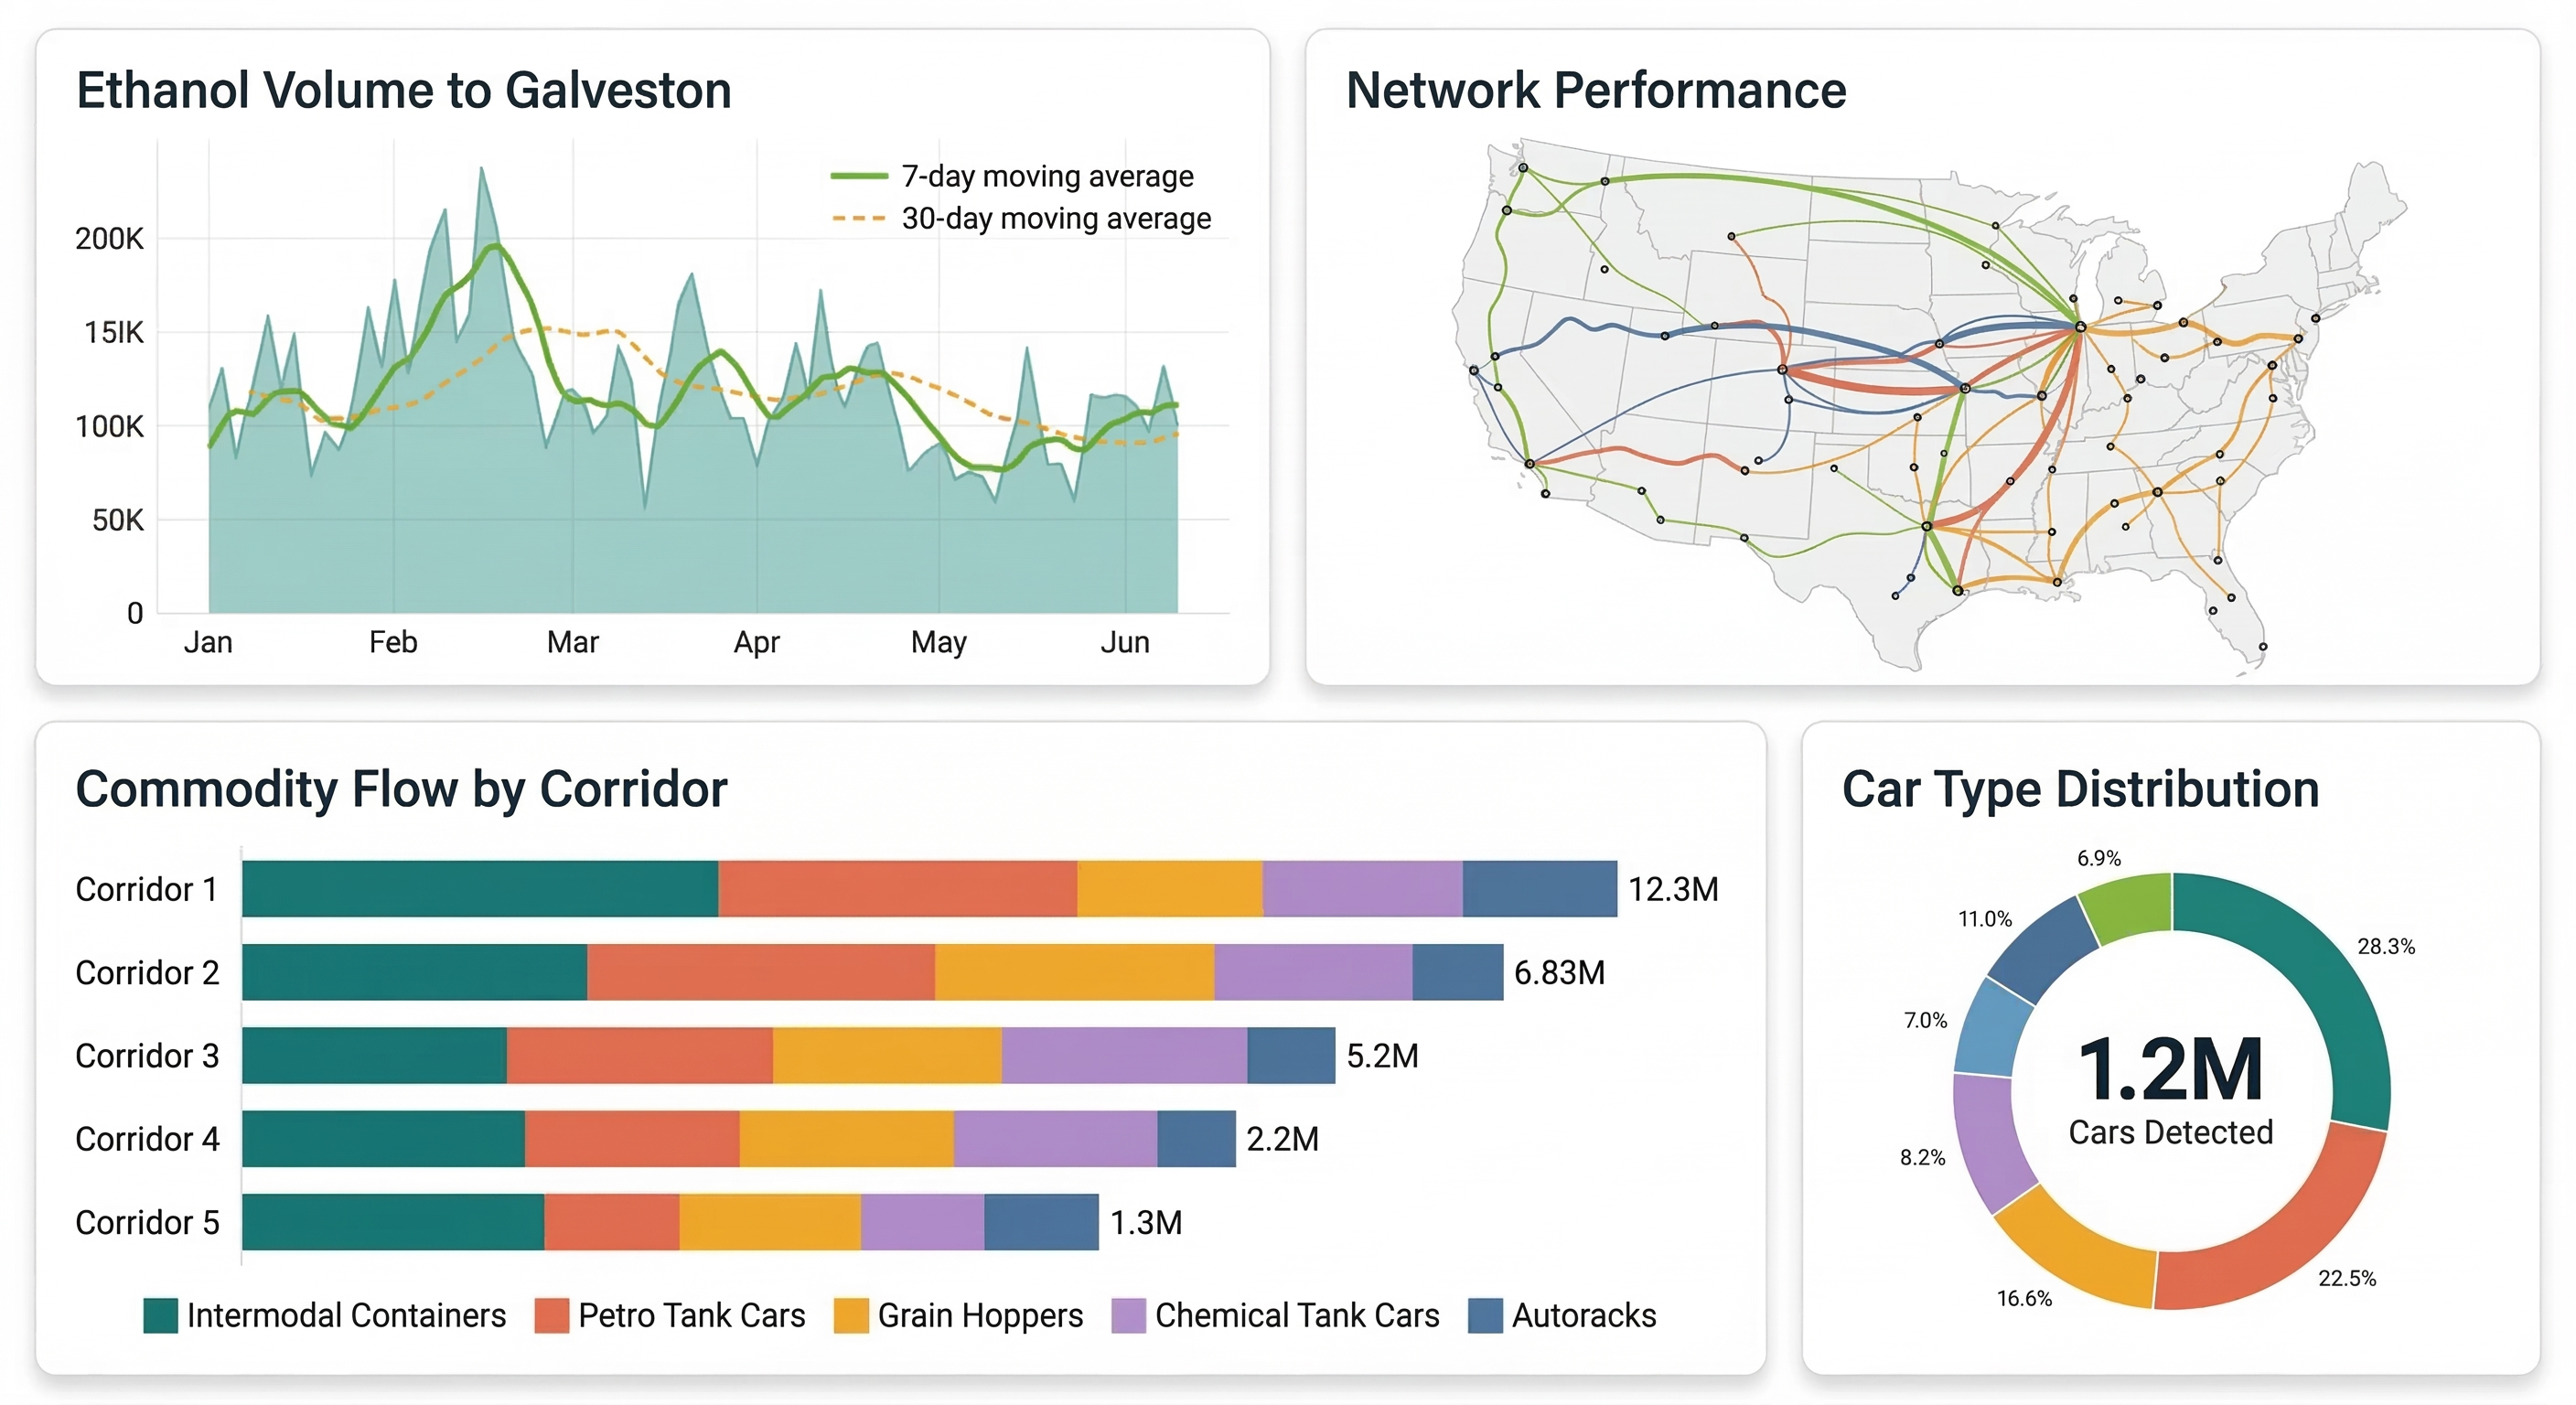
Structured, car-level data is delivered to customers through API integrations, automated data feeds, and interactive dashboards — all within 30 minutes of the train passing the sensor. This is weeks or months ahead of government statistics, industry surveys, or company-reported figures, giving customers a real-time view of freight flows that no other source can match.
<30 min Data Latency
Continuous Data Updates
API Delivery
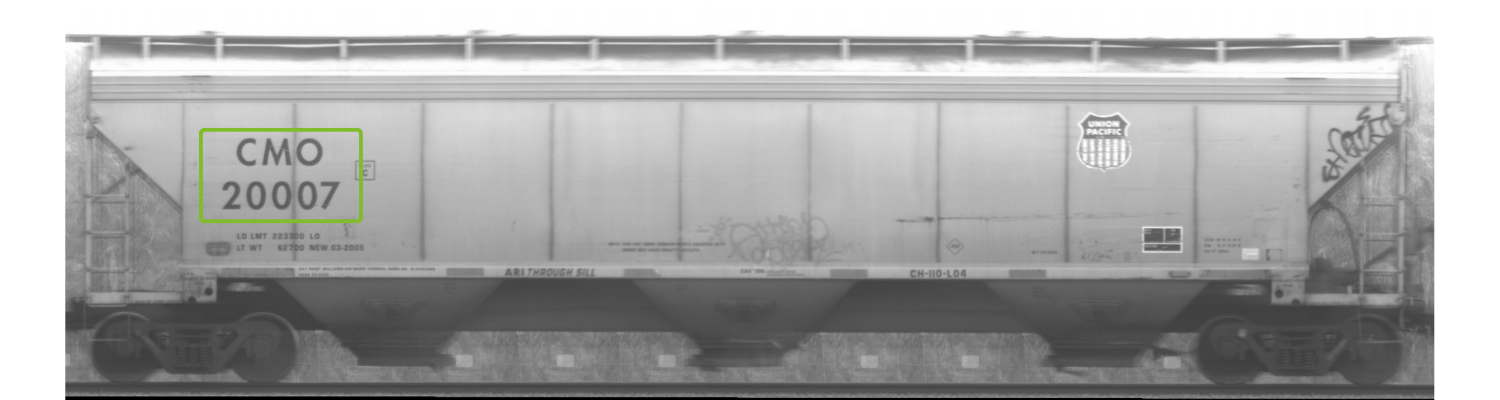
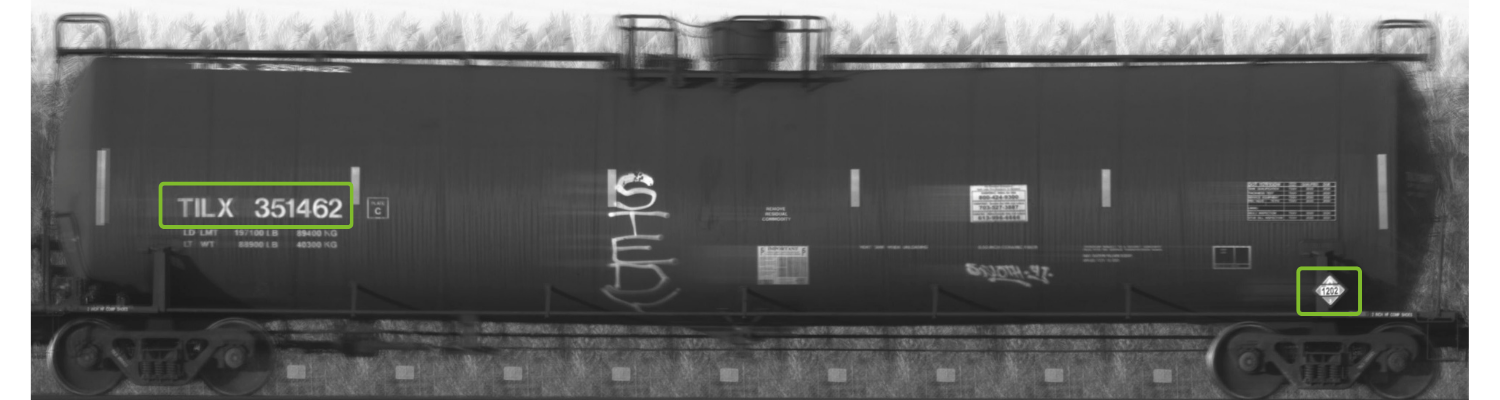
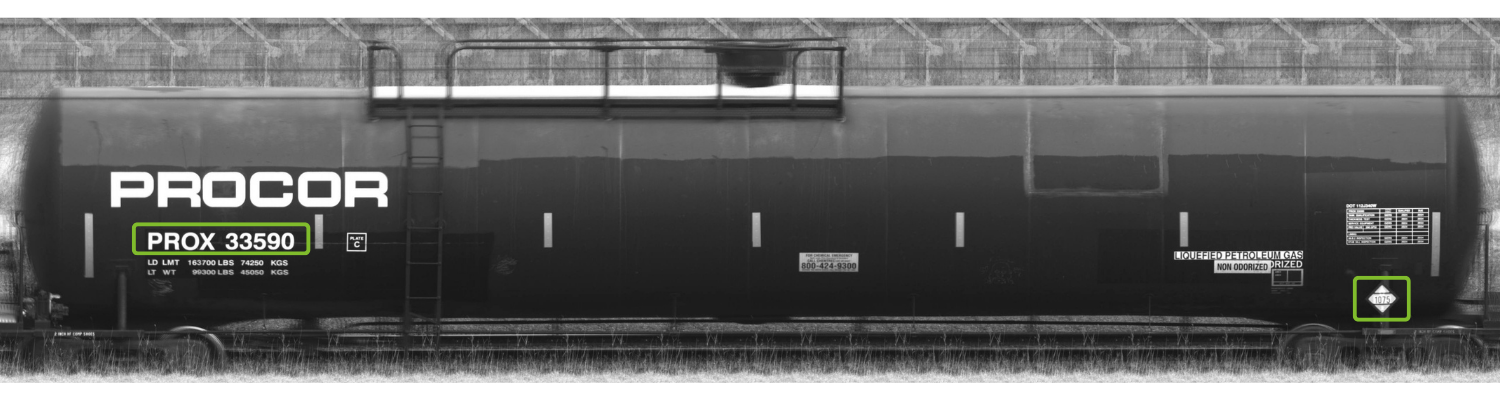
Every train that passes a RailState sensor is photographed at car-level resolution. Our image processing pipeline extracts structured data from each image — identifying equipment type, reporting marks, container branding, hazmat placards, and commodity indicators.
Covered Hopper
Hover to magnify
Covered Hopper
Transports grain, potash, fertilizers, plastic pellets, and other dry bulk commodities
Diesel Tank Car
Hover to magnify
Tank Car — Diesel
UN placards and reporting marks identify commodity type, capacity, and equipment owner
LPG Tank Car
Hover to magnify
Tank Car — LPG
Pressurized tank cars carrying liquefied petroleum gas identified by hazmat placards and car dimensions
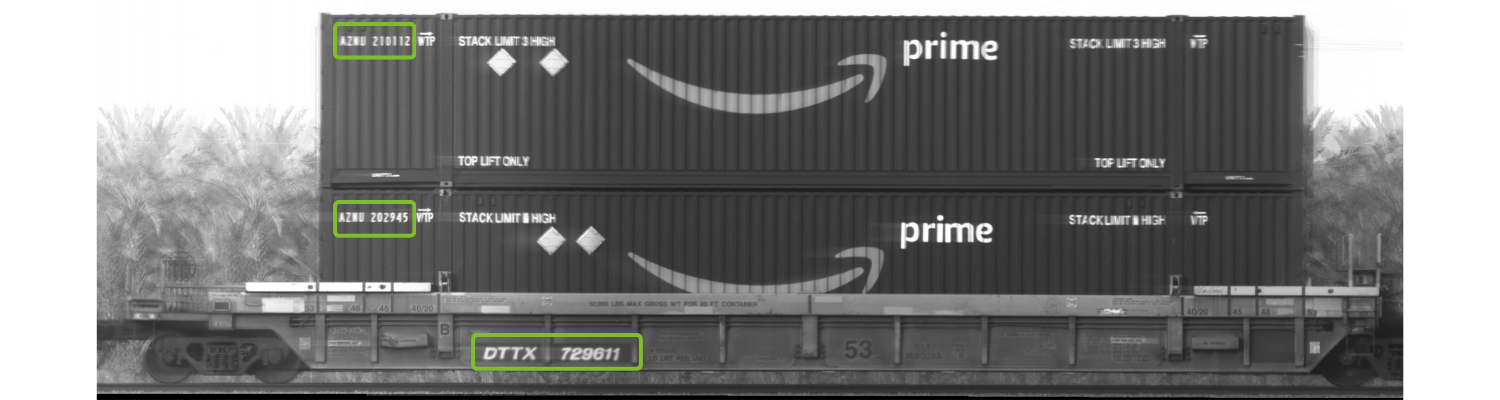
Domestic Container
Hover to magnify
Domestic Container
53-ft domestic containers and trailers on well cars — owner and container ID captured
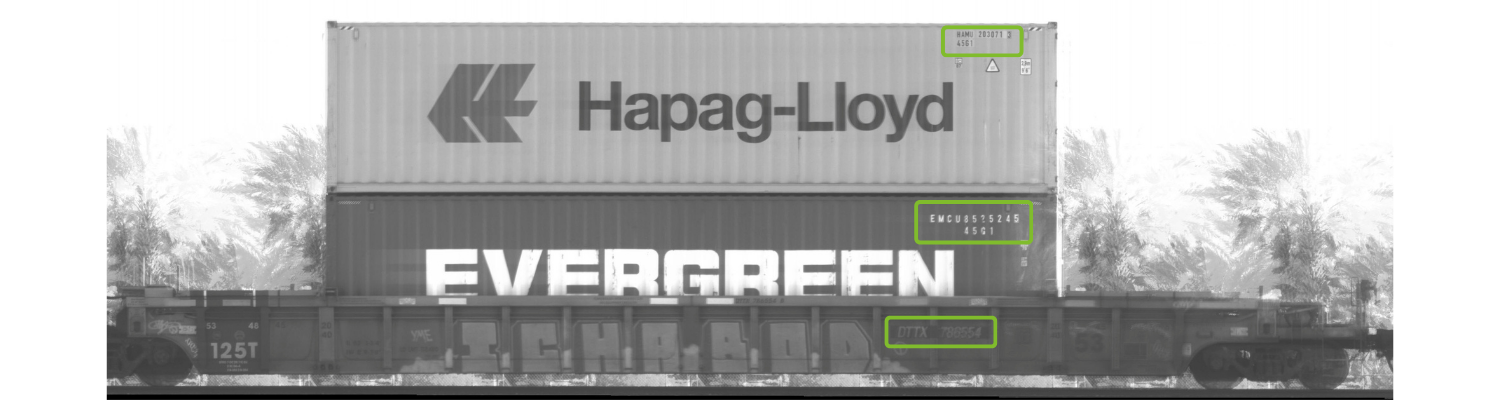
International Container
Hover to magnify
International Container
20-ft and 40-ft ISO containers — shipping line, size code, and container number identified
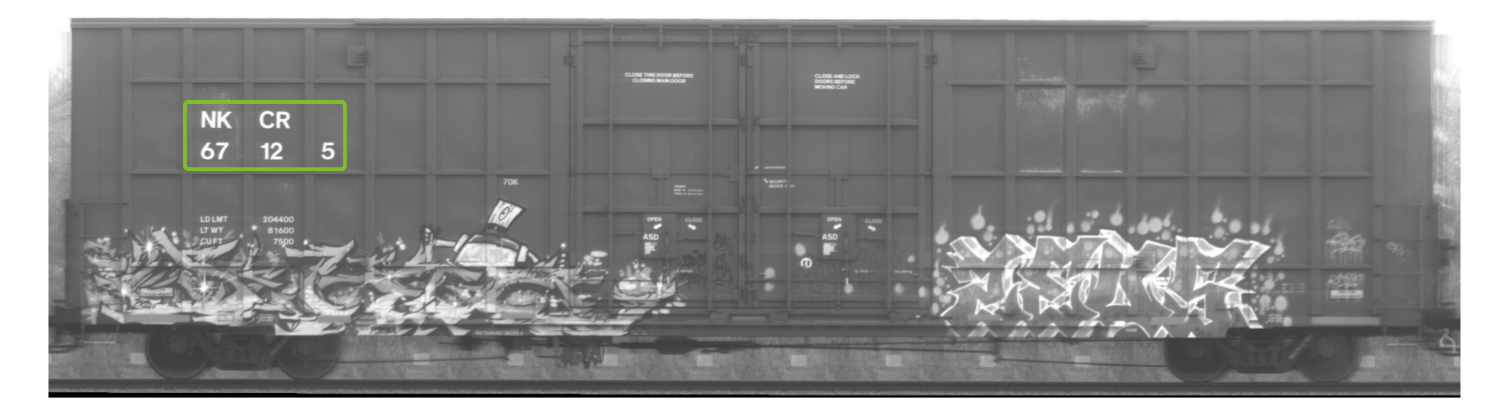
Box Car
Hover to magnify
Box Car
Enclosed cars for lumber, forest products, paper, and packaged goods — reporting marks and owner captured
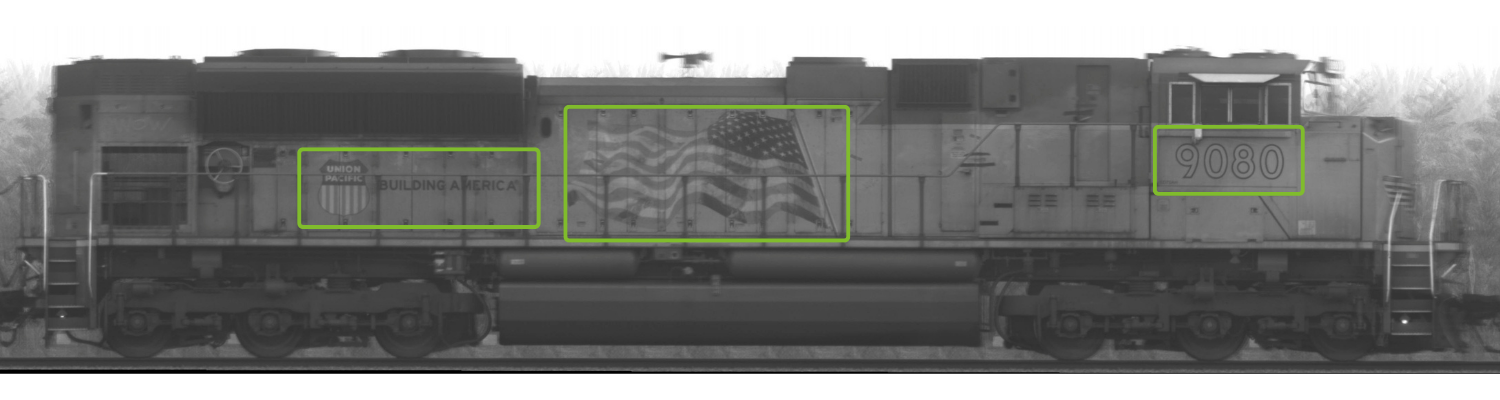
Union Pacific Locomotive
Hover to magnify
Locomotive
Lead and trailing locomotives identified — railroad operator, locomotive number, and model captured for every train
Every train observation produces a rich, structured data record. Data elements are organized into six categories:
Train Data
  • Train type
  • Train operator
  • Count of cars and containers
  • Composition of cars in order
  • Estimated cubic capacity
  • Estimated liquid capacity
  • Estimated gross weight
  • Estimated tare weight
  • Estimated load limit
  • Estimated length
Railcar Data
  • Railcar type
  • Car ID number
  • Car location in consist
  • AAR car code
  • Equipment owner
  • Cubic capacity
  • Liquid capacity
  • Gross weight
  • Tare weight
  • Load limit
  • Length
Movement Data
  • Location of sighting
  • Train direction
  • Train speed
  • Detection time
  • Detection duration
  • Travel time between locations
  • Train trip history
  • Car movement history
  • Car cycle time
Container Data
  • Container count
  • Container type (20ft, 40ft, 53ft)
  • Container ID number
  • Container position on car
HAZMAT Data
  • HAZMAT UN placard number
  • Hazard class
  • Empty placard holders
Locomotive Data
  • Locomotive number
  • Locomotive EPA emissions tier
  • Locomotive owner
RailState tracks a broad range of commodities across the North American freight rail network, organized by commodity family:
Petroleum & Energy
Crude Oil
Crude-by-rail movements across key corridors and export terminals
Diesel
Diesel fuel tank car movements across North American rail corridors
LPG (Propane & Butane)
Propane and butane tank car and unit train movements across the network
Ethanol
Denatured and undenatured ethanol movements across rail corridors
Agriculture & Fertilizers
Grain
Corn, soy, wheat, canola, and DDGs — covered hopper movements by railroad
Potash & Fertilizers
Covered hopper export volumes from Saskatchewan mines through Pacific coast ports
Anhydrous Ammonia
Pressurized tank car movements for agricultural fertilizer and industrial use
Frac Sand
Covered hopper movements of proppant sand for hydraulic fracturing operations
Mining & Minerals
Coal
Thermal and metallurgical coal — port-bound export volumes and mine-to-terminal tracking
Iron Ore
Gondola and hopper movements from mines to steel mills and export terminals
Copper Concentrate
Bulk movements from mining operations to smelters and port facilities
Sand & Cement
Construction materials including aggregate sand, cement, and related bulk commodities
Chemicals & Industrial
Chlorine
Pressurized tank car movements for water treatment and industrial chemical supply
Plastic Pellets
Covered hopper movements of polymer resin pellets from production to manufacturing
Industrial Chemicals & Gases
Sulfuric acid, hydrogen peroxide, CO2, and many other chemical and gas tank car flows
Methanol
Rail movements and market intelligence for methanol tank car flows
Forest Products
Lumber & Forest Products
Lumber, pulp, and other forest products moving through western Canadian ports
Wood Pellets
Biomass pellet export volumes through Prince Rupert and other BC terminals
Intermodal & Vehicles
Intermodal Containers
All international containers (20-ft, 40-ft), domestic containers and trailers, and refrigerated containers
Autoracks
Rail cars moving automotive parts and finished vehicles
Sensor Network
Active RailState sensor locations across the United States and Canada, covering both the Canada–US and US–Mexico borders
Total Active
sensors
United States
sensors
Canada
sensors
Data History
4 Yrs
up to
Active sensor
BNSF
UP
CSX
NS
CN
CPKC
Network Coverage & Expansion
Current sensor coverage and planned expansion across North America
Current Coverage
340 active sensors across the US and Canada covering major freight corridors and border crossings
Next 30 Days
New sensor installations in progress, expanding coverage into additional corridors
Next 30–90 Days
Planned expansion areas targeting key commodity flows and underserved routes
⌘ / Ctrl + scroll to zoom the map
What's in This Dashboard
Click any card to navigate directly to that section
Macro
Western Canada Ports
Container imports and bulk export commodities (coal, grain, potash, wood pellets) through Vancouver and Prince Rupert by CN and CPKC.
LA/LB Containers
International TEU and domestic container volumes through Southern California on BNSF and UP, with steamship-line market share.
Commodities
LPG Cross-Border
Propane and butane rail exports crossing the US–Canada border, benchmarked against CER — accurate within 0.4% and 2+ months ahead.
Ethanol — NY Harbor
Inbound ethanol delivery pipeline to the New York Harbor region, tracked at 3-day, 2-day, 1-day, and arrival stages.
Ethanol — Houston
Southbound ethanol toward the Texas Gulf Coast (Houston-area) export terminals at Texas City and Galveston.
Grain
Animated Pacific Northwest inbound grain car-trips from interior origins to the seven PNW export-port groups, by railroad.
Coal
Weekly coal tonnage railed to Western Canada export terminals — Trigon (Prince Rupert), Westshore and Neptune (Vancouver) — by producer.
Companies & Facilities
Methanex
Methanol rail movements from the Medicine Hat, AB plant, with the Methanex (MEOH) share price.
CPKC
CPKC grain shipment volumes vs company-reported carloads, with the CPKC (CP) share price.
Glencore
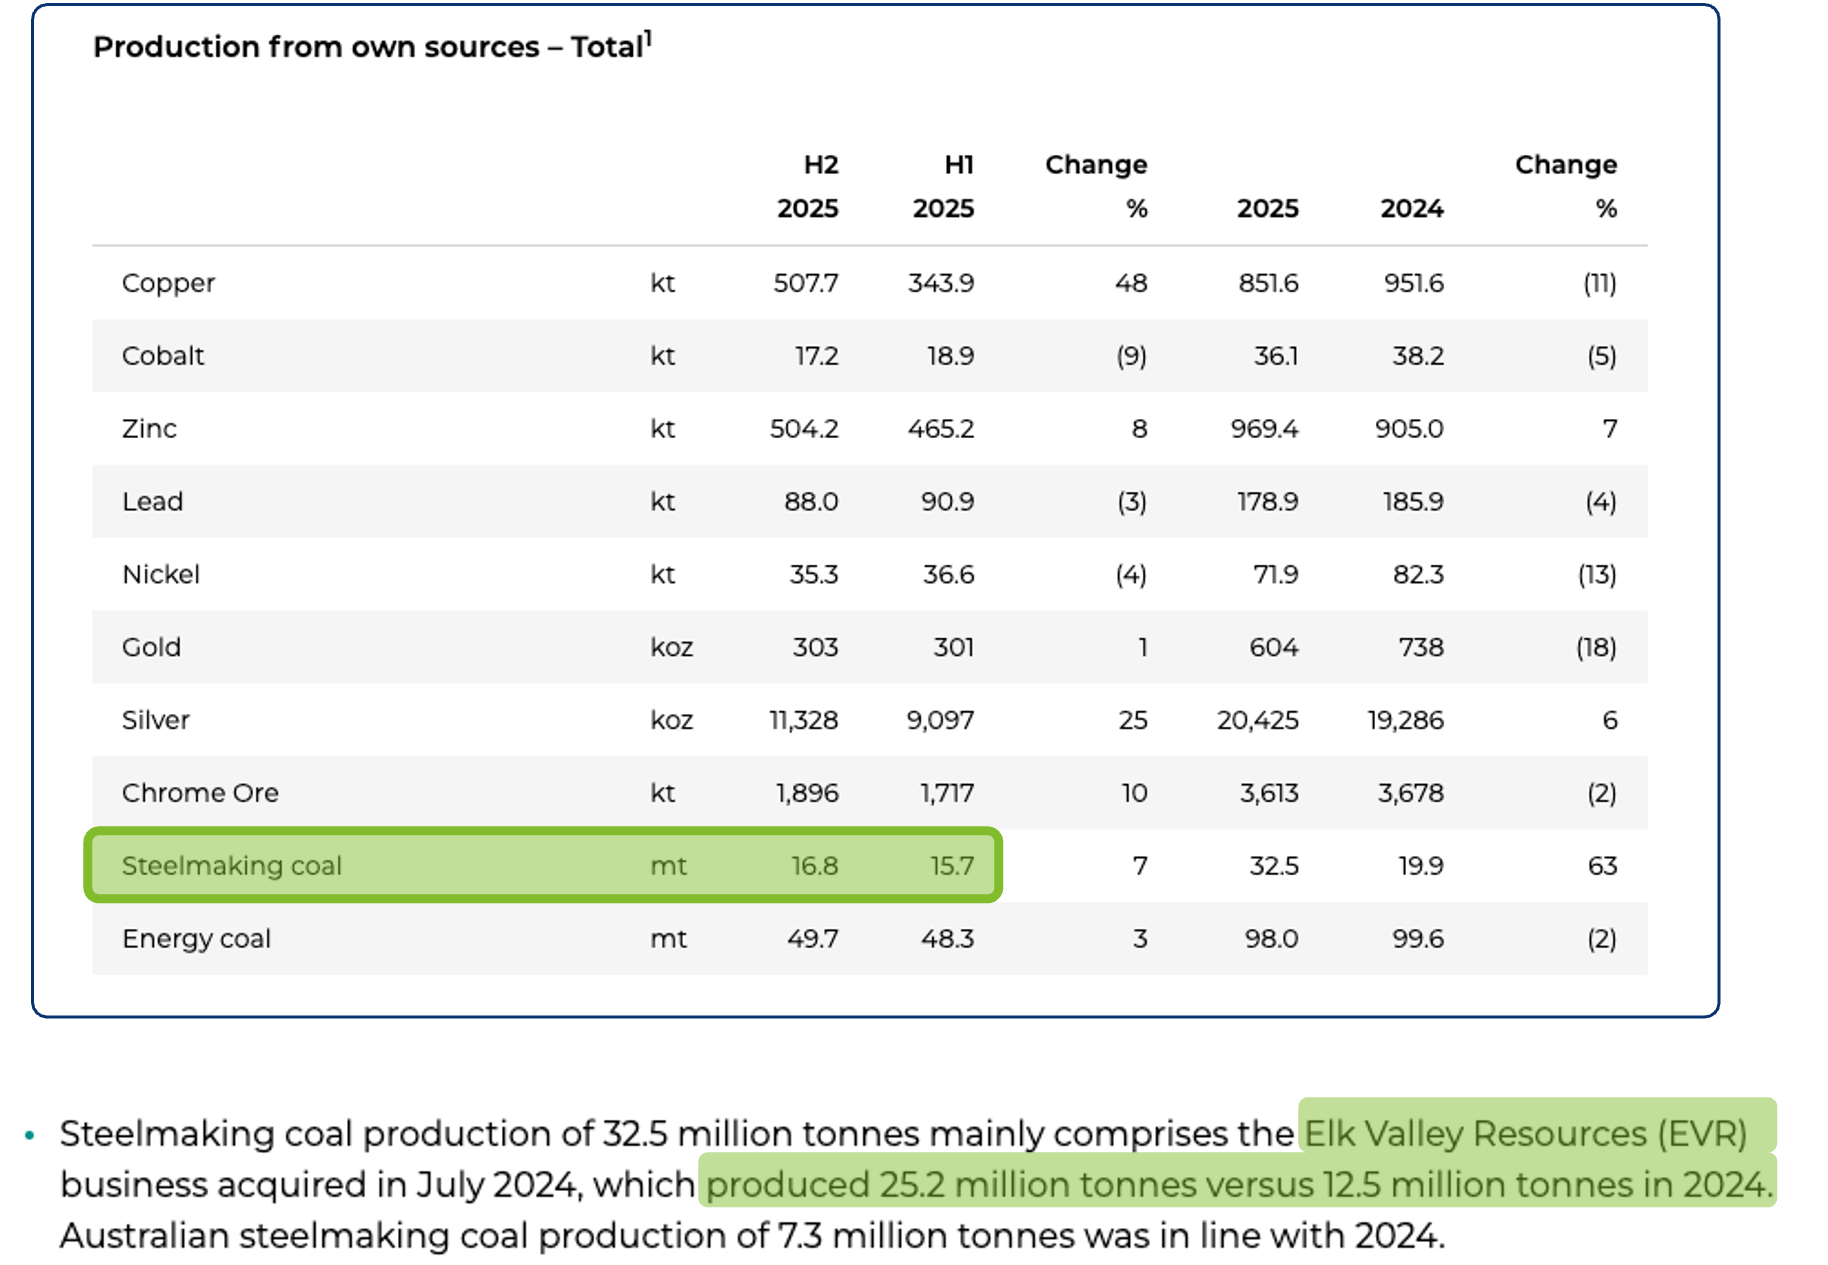
Elk Valley Resources steelmaking coal vs Glencore's semi-annual production reports, with the Glencore (GLEN.L) share price.
Drax
Drax Group wood pellet exports via Prince Rupert, with the Drax (DRX.L) share price.
Boeing
737, 767 & 777 fuselage flatcars (TBCX) moving west to final assembly in Washington, with corridor map and example captures.
Trusted By
Government agencies, commodity producers, and infrastructure operators rely on RailState data
Transport Canada
USDA Agricultural Marketing Service
Canadian Transportation Agency
Port of Prince Rupert
BHP
Alberta Transportation and Economic Corridors
California Air Resources Board
Lawrence Berkeley National Laboratory
Strong Pine Energy Services
Oregon Department of Transportation
LPG Cross-Border
Canada → US · Propane & Butane · Rail Exports at 11 Border Sensors
RailState Through
Today
Near Real-Time
Latest CER Data
Canadian Energy Regulator
RailState as a Percent of Canadian Energy Regulator Data
March 2024 to most recent government data
0.4%
RailState data has proven accurate within 0.4% of official figures — and front-runs the official reported data by more than two months, giving a clear view of cross-border LPG flows long before government sources publish.
Ethanol — NY Harbor
Inbound ethanol delivery pipeline to the New York Harbor region
RailState Through
Today
Near Real-Time
Census Data Lag
35–40 Days
Government data delay
NY Harbor — Ethanol Delivery Pipeline
Tracking Ethanol Inbound to NY Harbor
RailState sensors measure ethanol rail car movements at multiple points along the delivery corridor into the New York Harbor region. By tracking cars at 3 days out, 2 days out, 1 day out, and upon arrival, we build a real-time pipeline view of inbound supply — visibility that no public data source provides at this granularity.
RailState Sensor Network — NY Harbor Ethanol Corridor
Live sensor positions along the North American rail network. Ethanol pipeline sensors are color-coded by measurement stage; all other RailState sensors shown in grey.
3 Days Out
2 Days Out
1 Day Out
Arrived at NY Harbor
Other RailState Sensors
BNSF
UP
CSX
NS
CN
CPKC
Ethanol — Houston
Southbound ethanol toward Texas Gulf Coast (Houston-area) export terminals
RailState Through
Today
Near Real-Time
Census Data Lag
35–40 Days
Government data delay
Texas Gulf Coast — Export Corridor
Tracking Ethanol to Texas City & Galveston
RailState sensors at Crabb, TX and League City, TX measure southbound ethanol rail car movements heading toward the Texas Gulf Coast export terminals. We track two UN placard types — UN1170 (undenatured ethanol, ≥80% concentration) and UN1987 (denatured alcohol) — and compare monthly volumes against US Census Bureau vessel export data from the ports of Texas City and Galveston.
714 barrels per car
RailState Sensor Network — Texas Gulf Coast Ethanol Corridor
Sensor locations tracking southbound ethanol movements toward Texas City and Galveston export terminals.
RailState sensor
UP
BNSF
Methanex — Medicine Hat
Methanol Production Facility · Rail Shipment Tracking · RailState Sensor Coverage
RailState Through
Near Real-Time
Data History
Jan 2024
Monthly & daily volume
Facility
Medicine Hat, AB
Methanex methanol plant
Methanex Corporation operates the only methanol production facility in Canada, located in Medicine Hat, Alberta. All methanol produced at this facility is shipped by rail on the CPKC network, making it possible for RailState to capture the complete output of Canadian methanol production by monitoring four nearby sensors covering every outbound rail corridor. Tank cars carrying methanol are identified by the UN1230 hazmat placard and converted to metric tonnes at 89 tonnes per car based on 30,000-gallon tank car capacity.
Methanex Medicine Hat Facility
Satellite view of the Methanex methanol production facility in Medicine Hat, Alberta showing the rail infrastructure servicing the plant.
RailState Sensor Coverage — Medicine Hat Area
RailState wayside sensors surrounding the Methanex facility capture all outbound methanol rail shipments in every direction. Bubble size reflects recent methanol car volume.
Methanex Corporation (MEOH) — Nasdaq
CPKC Grain
Canada Grain by Rail · RailState Sensor Data vs. CPKC Public Grain Reports
RailState Through
Today
Daily sensor reads — Canada grain
CPKC Public Data
Jan–Feb 2026
Only 2 months publicly reported
Comparison Months
2
Jan & Feb 2026 — CPKC grain reports
About This Comparison
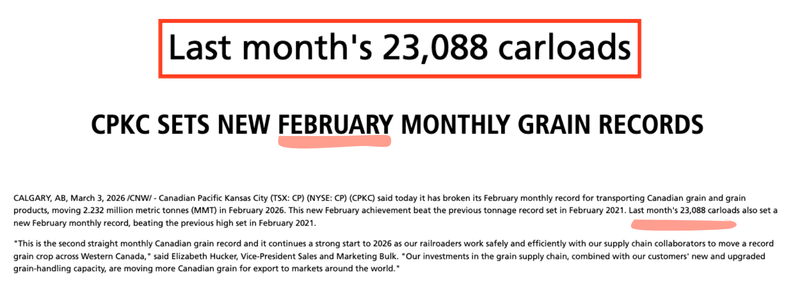
CPKC has recently reported record months of Canadian grain volume, but this data is not consistently published — only January and February 2026 have been publicly reported to date. RailState's independent sensor network observes grain car movements continuously across the CPKC network, providing volume estimates that closely match CPKC's own reported figures when available. The monthly comparison below shows 14 months of RailState sensor data alongside the two months where CPKC numbers exist for direct comparison.
RailState vs. CPKC Reported — Monthly Comparison
Direct Comparison — RailState vs. CPKC Reported
RailState Observed vs. CPKC Public Grain Reports
RailState sensor-observed carloads shown above each CPKC filing for direct comparison. These are the only two months where CPKC has publicly reported grain volumes.
January 2026
RailState Observed
24,840
carloads
+152 +0.6%
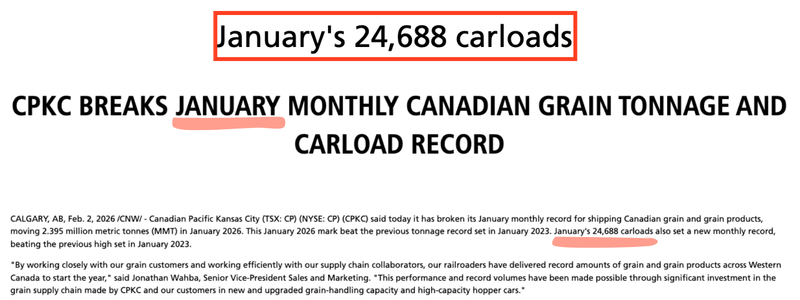
CPKC Reported: 24,688 carloads
CPKC January 2026 Grain Report
Source: CPKC January 2026 Grain Report
February 2026
RailState Observed
22,510
carloads
-578 -2.5%
CPKC Reported: 23,088 carloads
CPKC February 2026 Grain Report
Source: CPKC February 2026 Grain Report
Minor differences between RailState and CPKC figures may reflect differences in measurement timing. RailState records grain carloads based on the last observed sensor sighting during the month as cars move toward export terminals. CPKC's measurement timing may differ — for example, counting cars at origin loading or at a different point in the transportation cycle. These timing variations can shift a small number of carloads between adjacent months without affecting overall accuracy.
Past 90 Days — Canada Grain Daily Volume
Canadian Pacific Kansas City (CP) — NYSE
Glencore (Elk Valley Resources)
$GLEN · Steelmaking Coal · RailState Sensor Data vs. Glencore Production Reports
RailState Through
Today
Daily sensor reads — steelmaking coal
Glencore Reporting
Semi-Annual
Published >1 month after period end
Comparison Periods
H1 & H2 2025
Only semi-annual totals available
About This Comparison
Glencore's Elk Valley Resources is one of the world's largest producers of steelmaking coal. Glencore publishes production volumes only semi-annually, and reports are typically released more than a month after the end of each fiscal half-year — meaning H2 2025 data was not available until February 2026. RailState's sensor network independently tracks steelmaking coal movements from EVR operations in real time, providing continuous daily visibility into volumes that are otherwise only disclosed twice per year with significant delay.
RailState Monthly Observed Volume
The Timeliness Gap — Cumulative Volume
Glencore Production Report — Direct Comparison
RailState Observed vs. Glencore Reported
Semi-annual Glencore production report figures compared to RailState sensor-observed tonnage for the same periods.
H1 2025 (Jan–Jun)
RailState Observed
tonnes
Glencore Reported: tonnes
H2 2025 (Jul–Dec)
RailState Observed
tonnes
Glencore Reported: tonnes
Glencore Production Report
Glencore 2025 Production Report
Source: Glencore 2025 Production Report
Glencore reports production volumes semi-annually, typically more than one month after the close of each fiscal half-year. RailState provides continuous daily measurement of steelmaking coal movements from Elk Valley Resources operations, offering real-time visibility into volumes that would otherwise remain unknown until Glencore's next disclosure.
2026 Year-to-Date — Daily Volume
Glencore plc (GLEN.L) — London Stock Exchange
Los Angeles / Long Beach Containers
Ports of LA & Long Beach · Intermodal Container Movement · RailState Sensor Data
RailState Through
Today
Weekly sensor data
Data Period
Weekly since Sep 2024
Total TEU
International (20ft + 40ft)
Total Domestic
53ft containers + trailers
Weekly Container Volume — LA/LB Combined (BNSF + UP)
Container Volume by Company — Weekly Top 10
Western Canada Ports
Ports of Vancouver & Prince Rupert · Container Imports & Commodity Exports
RailState Through
Today
Weekly updates (Mon)
Data History
Up to 4 Years
Varies by sensor location
Ports Covered
2
Vancouver & Prince Rupert
Container Volume — Vancouver–CN (Weekly TEUs)
Container Volume — Vancouver–CPKC (Weekly TEUs)
Container Volume — Prince Rupert–CN (Weekly TEUs)
Export Volume by Commodity — Port of Vancouver
Port of Vancouver Exports — Past 90 Days (Daily)
Export Volume by Commodity — Port of Prince Rupert
Port of Prince Rupert Exports — Past 90 Days (Daily)
Total Western Exports by Railroad
Drax – BC Operations
Wood Pellet Exports via Prince Rupert · Covered Hoppers (≥6,000 cu ft)
RailState Through
Today
Near Real-Time
Data Period
2+ Years
Jan 2024 – present
Conversion
105 t/car
Estimated tonnes per car
Wood Pellet Carloads — Weekly & Monthly
Past 90 Days — Daily Volume
Drax Group (DRX.L) — London Stock Exchange
Grain
Pacific Northwest inbound grain flows · interior origins → PNW export ports
Window
Apr–May
2026 reporting period
Coloured By
Railroad
BNSF · UP
PNW Grain Rail Delivery — Inbound Flow Animation
Grain Car-Trips → PNW Ports
Each dot is a grain car-trip flowing from its interior origin (MT / ND / Prairies / CA) along the rail network to one of seven Pacific Northwest port groups. Rail-edge halos thicken with traffic; port bubbles are BNSF/UP delivery shares. Use the controls to filter by port or railroad and to play/scrub the timeline.
Coal
Weekly metallurgical & thermal coal railed to Western Canada export terminals
Data Through
Jun 7
Weekly volumes
Terminals
3
Trigon · Westshore · Neptune
Unit
Tonnes
105 t per car
Weekly Volume Railed by Producer → Terminal
Coal Railed to Export Terminals — Weekly
Stacked weekly tonnage by producer. Toggle to a single terminal or view all Western Canada ports combined.
Export Terminal Locations
Western Canada Coal Export Terminals
Trigon at the Port of Prince Rupert (Ridley Island); Westshore at Roberts Bank / Deltaport and Neptune on the north shore — both at the Port of Vancouver.
Boeing
737 · 767 · 777 fuselage flatcars (TBCX) · Westbound Edgerton KS → Renton/Everett WA
Fuselage Cars
Past 180 days · all models
Fuselage Corridor — Sensor Network & Route
RailState Sensor Network — Boeing Fuselage Corridor
Specialty fuselage flatcars (TBCX 737xxx / 767xxx) move west from Boeing's Wichita-area fabrication through Edgerton, KS toward final assembly in Washington State. Sensors along the BNSF route are highlighted.
Loaded Fuselage Cars — Daily Observations
Example Images — Loaded Fuselage Cars
Loaded Fuselage Cars Captured in Transit
RailState trackside cameras photograph every TBCX fuselage flatcar in transit. 737 fuselages ride open — the body and passenger windows are clearly visible; 767 and 777 fuselages travel in enclosed container-type boxes.